How to do Fundamental Analysis of Indian Stocks (Sh. Market P. 7)
Hello, and welcome to your Website Finance Gurukul. I am here with final Blog of Share Market series The Share Market Part 7. We have learned Basics of Share Market in our previous blogs now time to Know deeper about Market, “The Fundamental Analysis”. If you don’t have read yet Share Market Part 6, Go and Read. The Indian Share Market, a vibrant hub of economic activity, offers a treasure trove of investment opportunities. But with great potential comes the responsibility of making informed decisions. If you do not analyze a Stock properly then it will be your Liability instead of your Asset.
Fundamental analysis emerges as your trusty compass, guiding you towards stocks with strong underlying value. In this in-depth guide, we’ll equip you with the knowledge and tools to navigate the world of fundamental analysis for Indian stocks, empowering you to make strategic investment choices.
Fundamental Analysis is a holistic approach to study a business. When an investor wishes to invest in a business for the long term (4 – 5 years) it becomes extremely essential to understand the business from various perspectives. It is critical for an investor to separate the daily short-term noise in the stock prices and concentrate on the underlying business performance. Over the long term, the stock prices of a fundamentally strong company tend to appreciate, thereby creating wealth for its investors.
What is Fundamental Analysis?
Fundamental analysis is an investment methodology that transcends short-term market noise. It delves deep into a company’s core aspects, meticulously evaluating its financial health, future prospects, and competitive landscape. By scrutinizing these factors, you gain the ability to assess whether a stock’s current market price accurately reflects its true worth. Here’s how fundamental analysis differs from technical analysis, another popular approach:
- Focus: Fundamental analysis focuses on the intrinsic value of a company, whereas technical analysis focuses on historical price and volume data to identify trading opportunities. Fundamental Analysis provides you complete image of a Company.
- Time Horizon: Fundamental analysis is geared towards long-term investors, while technical analysis can be used by both short-term traders and long-term investors.
- Methodology: Fundamental analysis relies on financial statements, industry research, and company news, while technical analysis uses charts and technical indicators.
Why Embrace Fundamental Analysis? The Compelling Advantages
Integrating fundamental analysis into your investment strategy unlocks a multitude of benefits:
- Unveiling Hidden Gems: Imagine identifying companies with exceptional fundamentals trading at a fraction of their intrinsic value. Fundamental analysis equips you to unearth these hidden gems, offering the potential for significant capital appreciation in the long run.
- Investing with Conviction: Move beyond the whims of the market. Fundamental analysis empowers you to base your investment decisions on a company’s long-term growth trajectory, profitability, and financial stability, fostering a sense of conviction in your choices.
- Risk Mitigation: By thoroughly appraising a company’s financial strength, debt levels, and potential vulnerabilities, you gain a deeper understanding of the associated risks. This empowers you to make informed decisions and implement effective risk management strategies.
- Building a Well-Diversified Portfolio: Fundamental analysis encourages you to look beyond trendy sectors and popular stocks. By analyzing companies across different industries, you can construct a well-diversified portfolio that is resilient to market fluctuations.
A Step-by-Step Guide to Mastering Fundamental Analysis
Conquering the world of fundamental analysis for Indian stocks requires a structured approach. Here’s a roadmap to guide you:
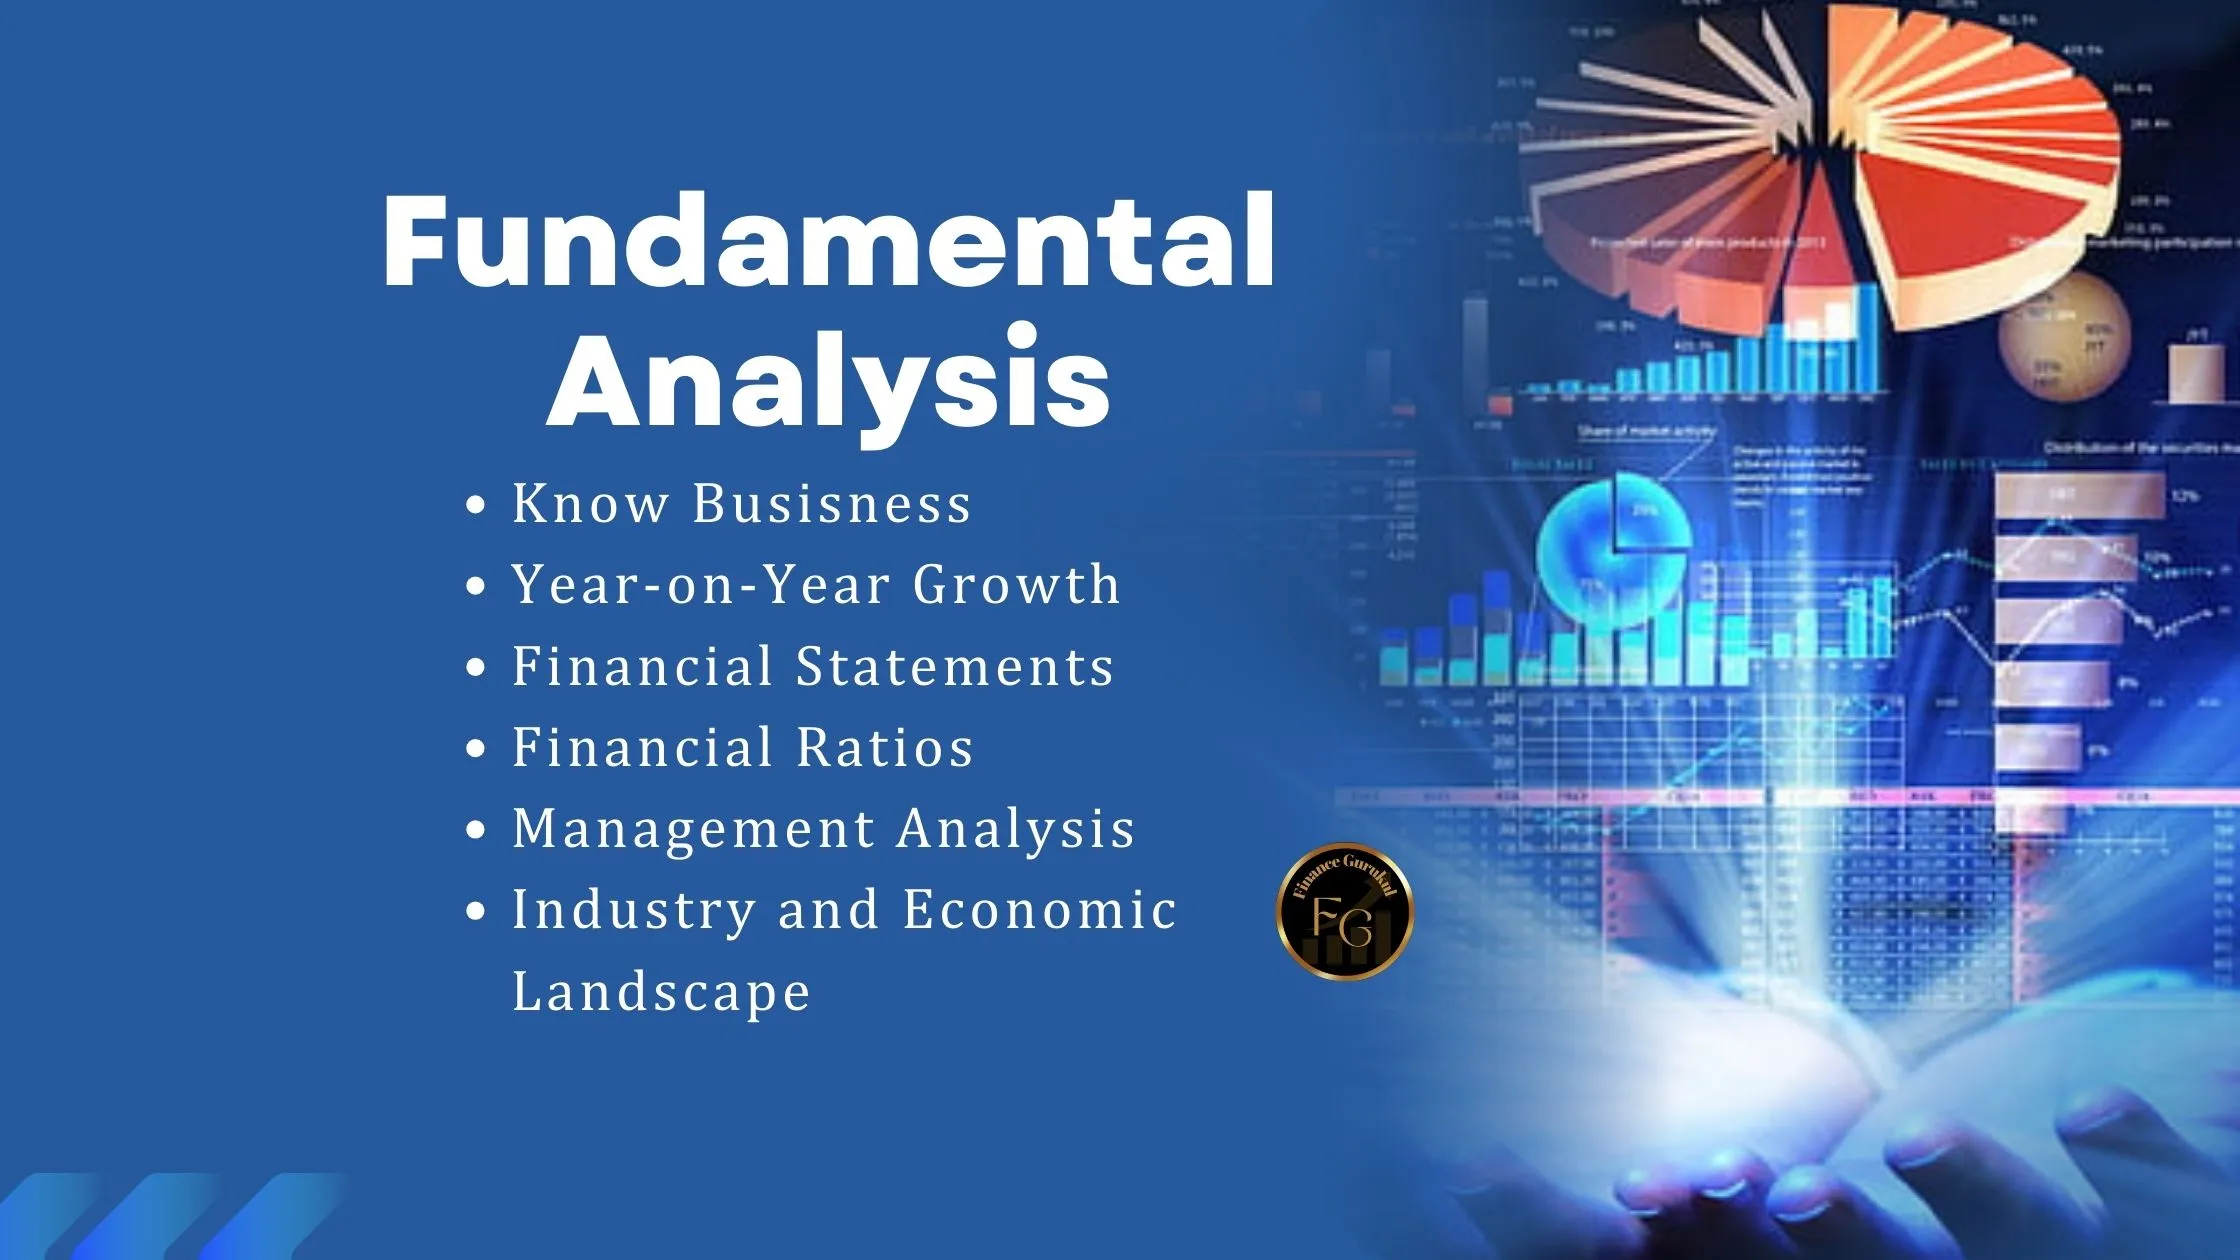
1. Demystifying the Business: Begin by unveiling the company’s story. Research its business model, the products or services it offers, its target market, and the factors that differentiate it from its competitors. Pay close attention to the company’s competitive advantages, its moat – the sustainable edge it has over its rivals.
2. Financial Statements: Financial statements – the income statement, balance sheet, and cash flow statement – form the bedrock of fundamental analysis. Analyse these statements meticulously to assess the company’s profitability, financial stability, and efficiency in generating cash flow. Look for trends in revenue growth, profit margins, and debt levels over time.
3. Financial Ratios: Financial ratios are powerful tools that condense complex financial data into easily digestible metrics. Leverage key ratios like the P/E Ratio, Debt-to-Equity Ratio, and Return on Equity (ROE) to evaluate a company’s profitability, leverage levels, and overall financial health. Benchmark these ratios against industry averages and the company’s historical performance to gain deeper insights.
- Market Cap: Market cap is the total market value of all of a company’s outstanding shares.
- Price to Earning (P/E) Ratio (TTM): P/E (price-to-earnings) ratio is the ratio of a company’s share price to its earnings per share (EPS). P/E ratio is used to determine whether a company is overvalued or undervalued.
- Price to Book Value (P/B) Ratio: P/B (price-to-book) ratio is the ratio of a company’s share price to its book value. Any value under 1.0 is considered a good P/B value.
- Industry P/E: The average P/E ratio of all the stocks in any sector. Different sectors consider different P/E ratios as healthy.
- Debt to Equity Ratio: Debt to Equity is the percentage of the total liabilities of a company (debt) to its shareholders’ equity. A higher debt to equity means the company is using more debt funds than equity funds, and a lower debt to equity means more equity than debt funds.
- Return on Equity (ROE): Return on equity (ROE) is a measure of financial performance, calculated by dividing net income by shareholders’ equity.
- Return on Capital Employed (ROCE): ROCE stands for Return on Capital Employed. It’s a financial ratio used to assess a company’s profitability and capital efficiency. In simpler terms, it tells you how well a company is generating profits from the capital it uses.
- Earnings per Share (EPS): Earnings per share (EPS) is a company’s net profit divided by the number of its common outstanding shares. It indicates how much money a company makes for each share of its stock.
- Dividend Yield: Dividend yield percentage is the amount of money a company pays its shareholders for owning a share of its stock divided by its current stock price.
- Book Value: The amount of money that a company’s shareholders would earn if it were liquidated and has paid off all liabilities.
- Face Value: The original value of a company’s stock as written in its books of accounts and its share certificates. Also known as par value, it is fixed when the stock is first issued.
- Current Ratio: The current ratio is a financial metric used to assess a company’s liquidity, which essentially means its ability to meet its short-term obligations. It specifically measures whether a company has enough current assets to cover its current liabilities. Formula: Current Ratio = Current Assets / Current Liabilities.
4. Management Analysis: A company’s success hinges significantly on the quality and experience of its leadership team. Scrutinize the management’s track record, vision, decision-making capabilities, and their ability to navigate challenges. Look for a management team with a proven ability to create shareholder value and a long-term perspective.
5. Industry and Economic Landscape: Don’t operate in isolation. Evaluate the overall health of the industry the company belongs to. Consider factors like growth prospects, government regulations, technological advancements, and any potential disruptions that might impact the industry’s performance. Analyze the broader economic environment, including factors like interest rates, inflation, and GDP growth, as these can significantly influence a company’s performance.
For a successful foray into fundamental analysis of Indian stocks, equip yourself with the right resources Like Annual reports of companies listed on the Bombay Stock Exchange (BSE) and National Stock Exchange (NSE) provide a wealth of financial data and insights.
The information contained on this blog is for general informational and educational purposes only and should not be construed as professional financial advice. Investing involves inherent risks, and past performance is not necessarily indicative of future results. You should always conduct your own research and due diligence before making any investment decisions.